Process
Showing my working for a data sonification
To give an idea of how a data sonification piece comes together, I want to show my process for a piece I created recently. Basically, I tend to work through three main phases: (1) preparation; (2) creating and building the sonification; and, (3) polishing up the sonification.
Before getting into the details, here is the sonification itself and a bit of background.
The idea for a sonification came out of a collaboration with Max Graze (a fellow information designer and data sonification artist). The starting point was wondering what a sonification of the seaweed blooms could sound like.
The data that shaped the piece of music is from the Optical Oceanography Laboratory at the University of South Florida. It records the size of Sargassum blooms in the Caribbean Sea between 2011 and 2022. These blooms have been increasing in size over recent years, an indirect effect of fertiliser runoff and deforestation. The blooms can cause problems too. When they dry out, they smell like rotten eggs. So washed up on a beach they make it a less appealing place to be, with potential knock on impacts on tourism industries. The blooms can also crowd out other species in the ocean, such as seagrasses and corals. You read more about the blooms in this BBC News article.
Preparation
The first step of the process was to clean and explore the data. Here is what is looks like. On first look it was clear to me that there are some nice peaks and seasonal variations which would shape the structure of the piece.
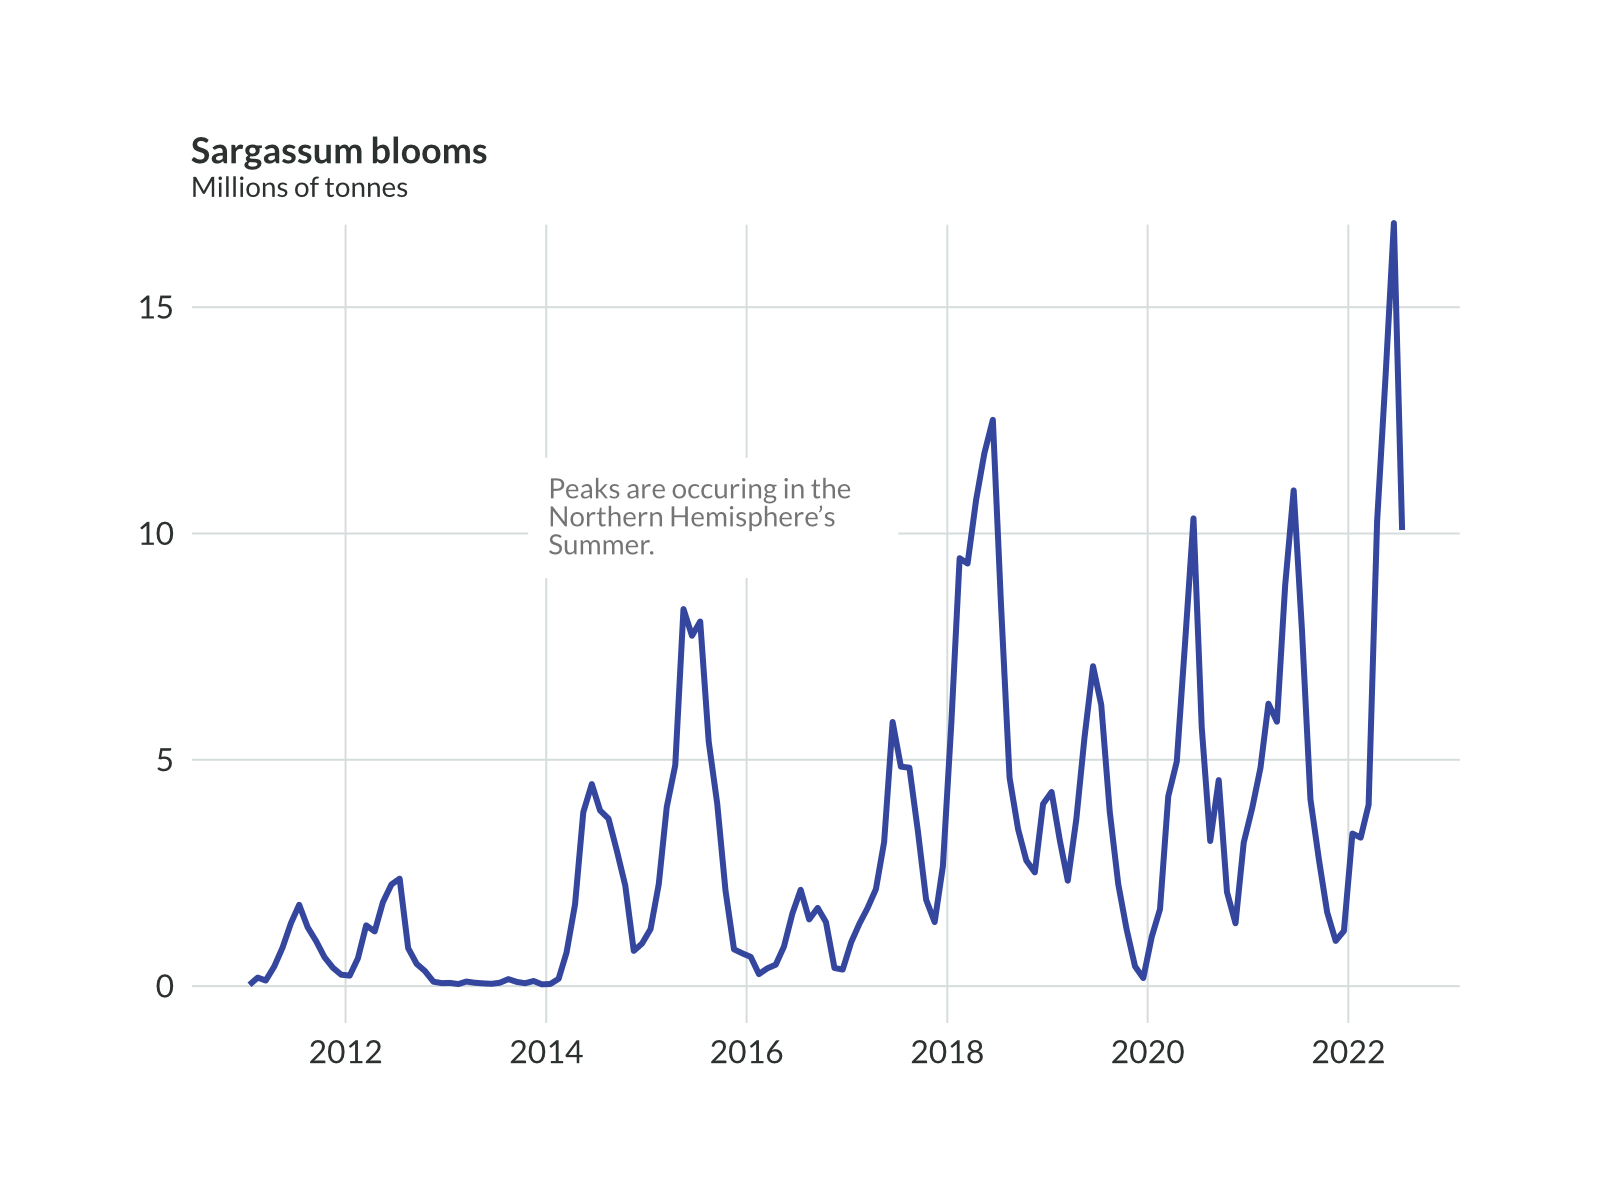
Source: Optical Oceanography Laboratory at the University of South Florida
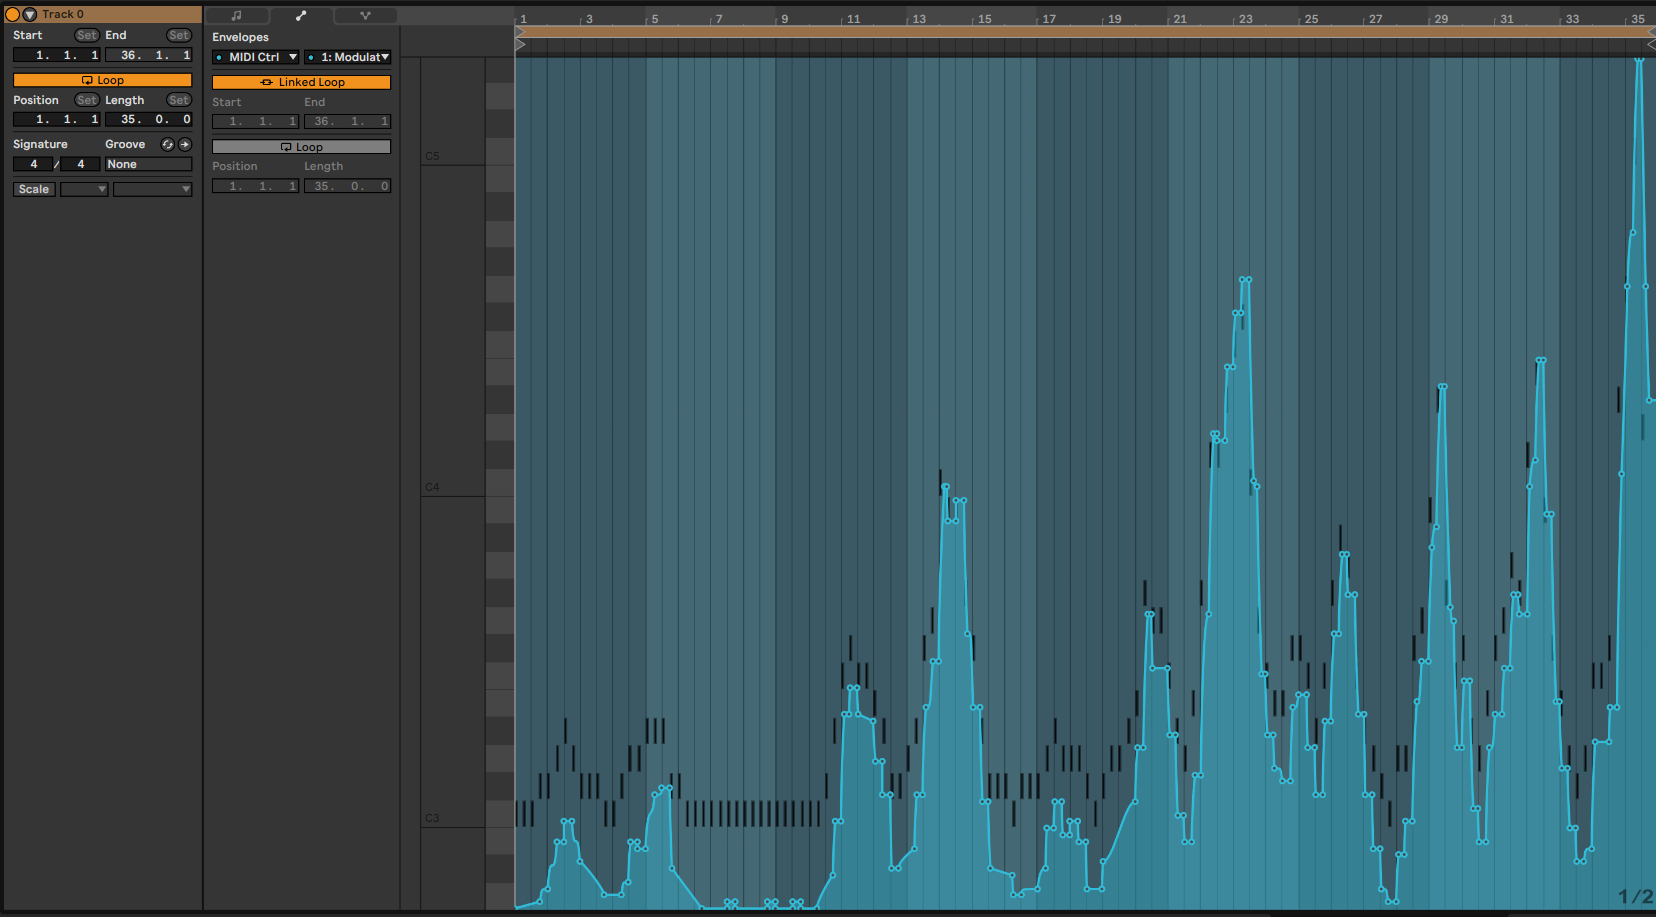
Then it is a case of getting the data into Ableton Live, this is the main software tool I use for creating music. I won’t go into the technical details here, other than to say that the Loud Numbers data sonification tool proves very useful. Here is the same data now in a musical context.
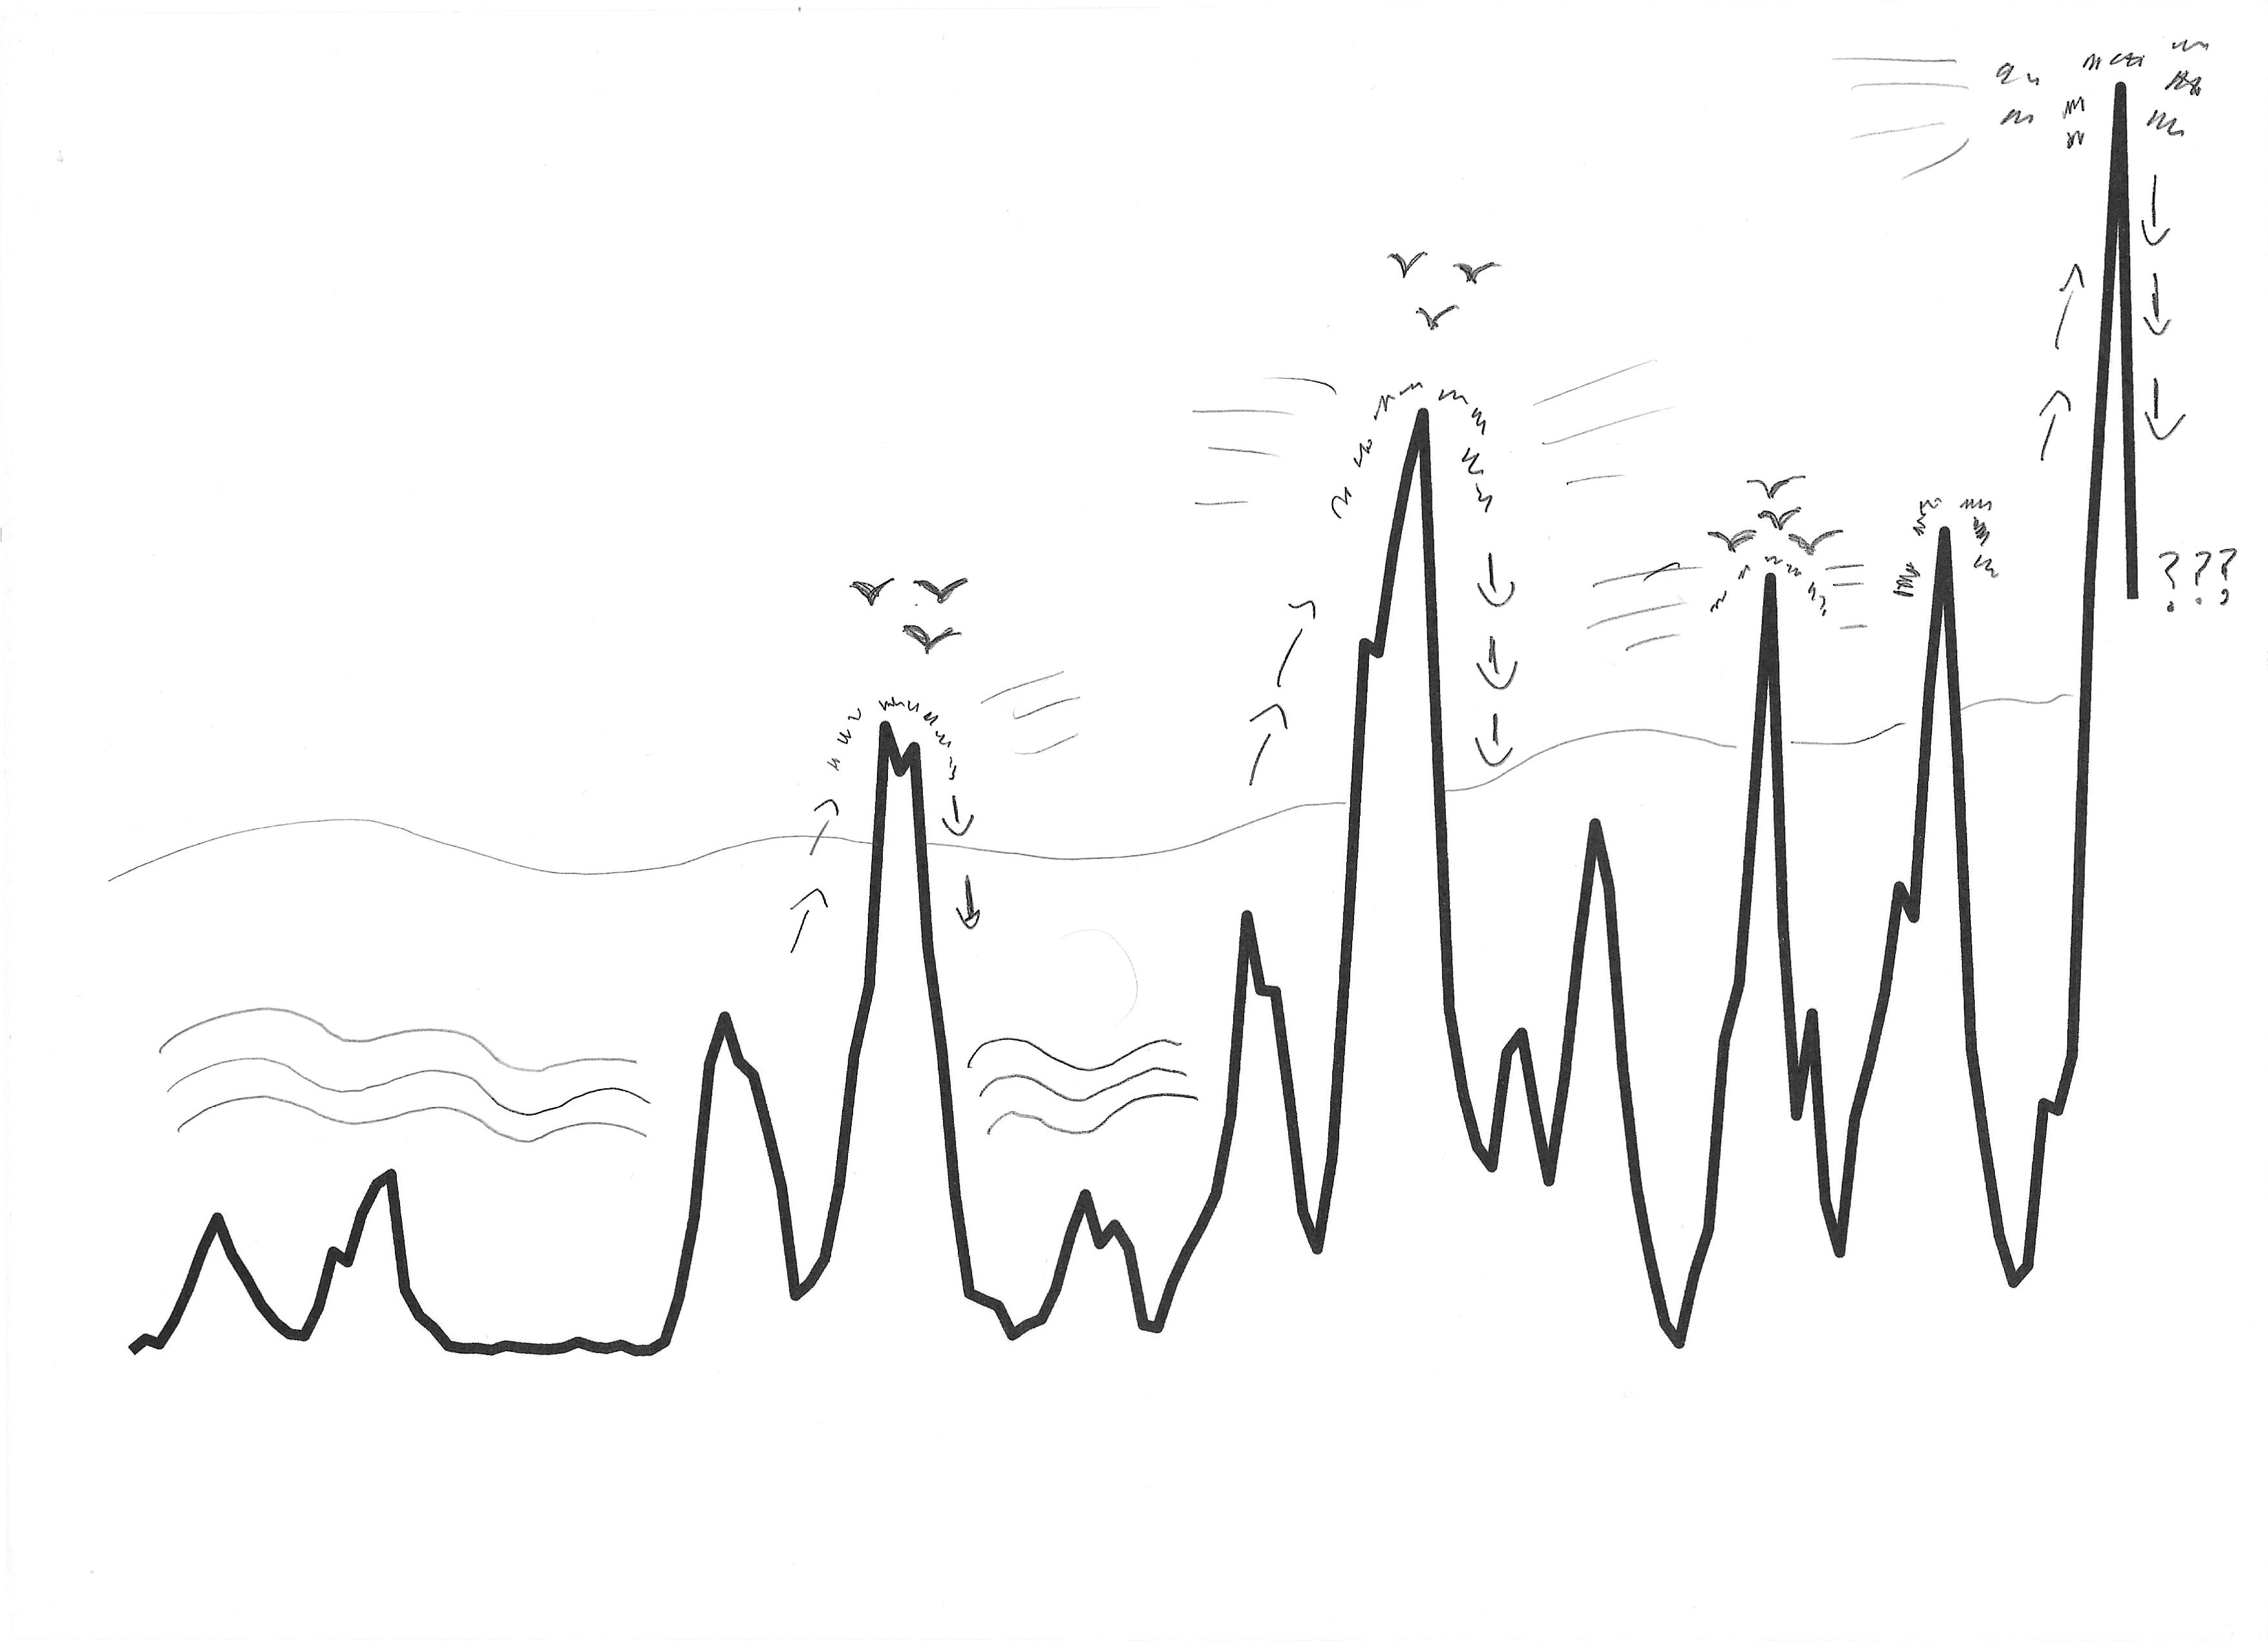
Next, I created a visual score, a visual representation of how I wanted the finished piece to sound. As you can see this very much based around the data, which I have then embellished. I try to capture the central, musical metaphor for the piece in the visual score. In this case, the metaphor draws on the idea that the visible parts of seaweed blooms on the surface are like volcanic islands rising out the sea. In both cases there is a lot going on out of sight and below the surface too.
The last part of the preparation phase was to design the sound of the lead instrument. This is the instrument which conveys the shape of the data. Again, I used the musical metaphor here. I tried to create a sense that sometimes the lead instrument is under water and sometime above, with heavy use of a low pass filter. I find it helpful to work with musical references throughout the sonification process. For the sound design for the Sargassum piece, I picked some tracks from Rival Consoles and Max Cooper. As they both use heavily low passed lead synths. You can listen to how things sounded at the end of the sound design phase here.
Creating and building the sonification
When creating a sonification I find myself moving seamlessly between different areas of musical practice. This allows me to place the data at the heart of the process, using the data and visual score to guide me through numerous musical decisions. Here are some examples from the Sargassum sonification, which I hope give some idea of how this looks in practice.
Mapping the data to sound: I used the data to control many aspects of the instruments and sounds. As I sit down to write this, I can’t remember them all! Plenty of experimentation went into refining the mappings between data and sound. The most obvious mappings are from the data to the filter cutoff and the amp envelop release of the lead instrument. These mappings make the sonification sound bigger and brighter when the seaweed blooms are larger.
Musical composition: At the heart of the Sargassum piece is a shifting and slowly evolving chord progression. This is primarily in A natural minor, with some chromatic diversions. This gives the piece a melancholy feeling, aligning with the concerning impacts of the seaweed blooms. To make things a little more ambiguous I used a range of chord extensions (7ths, 9ths and 11ths) and variations (e.g. sus4). This reflects upon the ambiguities of economic development, human driven environmental change and degradation. With the seaweed blooms being just one manifestation of these global trends. Finally, the progression is left ambiguously unresolved (musically) at the end of the track, as the seaweed blooms will continue to grow in the future. We have just run out of data!
Production and sound design: Just have a single, lead instrument within a sonification can limit the possibilities for communicating the data in musical form. So, I tend to fill out each piece with complementary sounds. In the Sargassum sonification these include the pads – which create a subtle wave like motion - and audio recordings from Ocean environments. These all seek to enhance the overall feel and evoke associations that connect with the meaning within the data.
Polishing up the sonification
The last phase of my process is polishing up the sonification, in technical terms mixing and mastering the sonification. It is important to understand how and where the sonification will be played. The mix for a sonification to played in the background of video would be different to the mix for a sonification to be played in a conference hall. For the Sargassum sonification, I went for a mix targeted at headphone listeners and some basic mastering. For a sonification being released on streaming services I would work with a professional mastering engineer.
With thanks to
- Maxene Graze for collaborating on ideation and research for the sonification.
- Chuanmin Hu for access to, and support with, the data.
- Juskiddink on Free Sounds for the recording of seagulls that features in the sonification.